Analytical trip report
About the document
- The purpose of creating this document was to monitor each month’s expenses for each trip, that is, to compare that the expenses incurred per trip versus the average spent on that same route and made by the same operator within a period of two and a half years.
- The product weight in between same routes is relatively similar, therefore the total weight of the unit is not a variable to be considered.
- This document was realized in Excel using formulas, the values self-actualize on a monthly basis, obtaining information from the database of trips made.
- If I had presented this document to the stakeholders, I might have chose to use a more aesthetic format, much easier to understand, probably in a dashboard, but since it was only for my personal use I chose keeping it rather simple to look at concrete values.
IMPORTANT: in order to comply with my former employer’s right to data privacy, several attributes such as client names, number of trips, as well as any piece of information regarding earnings/profit have been anonymized or erased, I have consent to use the non-sensitive data. Please consider this isn’t the full document and it’s only to showcase the methods used.
Introduction
The largest variable expense for a trucking company is fuel, which is why keeping track on that subject is crucial to optimize costs. By keeping a close eye on variable costs we could ensure that the resources were used in the best possible way. If any route expenses were above average, a revision would take place in order to analyse the causes and prevent them on future trips.
Analytical Trip report
Expenses-1The final document had 1,449 cells, all of them calculated by formulas, none of the values shown above are “written” but taken automatically from the database.
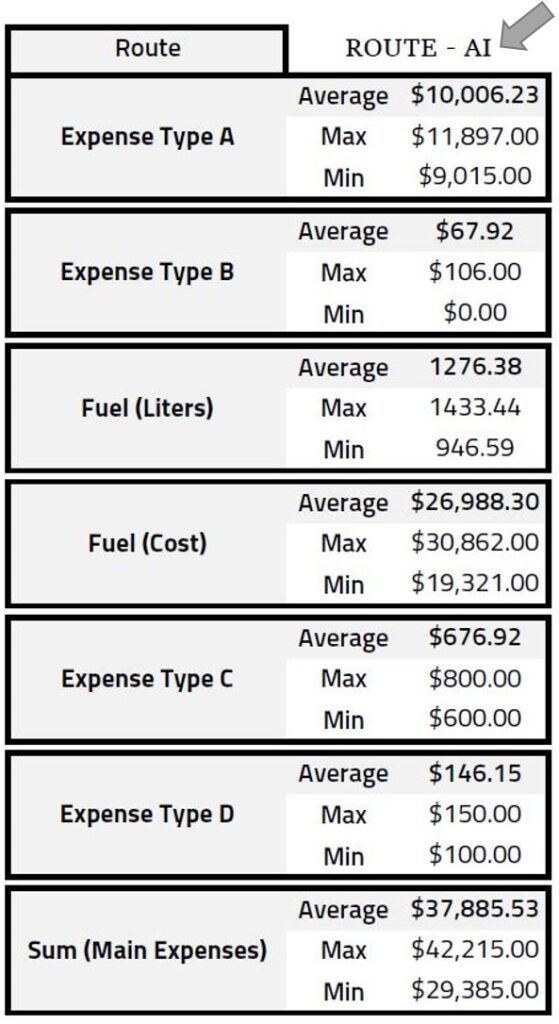
route summary
By choosing a route from the drop-down list (gray arrow), the values for that particular destination are automatically obtained. That way it’s easier to find the values for any route in the database.
For analytical purposes, “Expense Type A” as well as Fuel Cost are the two main expenses during the trip therefore the two most important elements to monitor. In this case, fuel cost can be tricky since prices can fluctuate, that’s why using Liters instead of prize is better.
Any trip made has to be checked against this values to ensure that their expenses are adequate.
After this, I created graphics showing all the trips on one route by date and it’s expenses. But for data protection reasons I can’t showcase those as they explain the number of trips to a given destination, which can be used to make an aproximation on the utility of the company, therefore classified as confidential information.