
Toluca City Council Historical Budget Analysis
About the document
- This information is part on an investigation made on 2020 and presented to the City Council Secretary and its team to analyse the current economic situation of the city and derive meaningful insights from data on the last 20 years.
- The data was gathered from 3 distinct national public databases containing information on the 2446 municipalities of the country
- I used Excel in the data processing and analyze phases and PowerPoint for the final visuals.
- The final document was 104 slides long (quite lenghty I know, but needed to cover every single aspect of the city budget) and I gave it as a course to all the employees, for showcase purposes I’m only using a fraction of the information contained in the document.
- NOTE: the original document was made in its entirety in spanish.
Introduction
The 2018 elections gave way to a new party that won in a large number of states and therefore in its municipalities. Given this, the Mexican population expected a substantial change in the way public finances were handled, to sustain this new reality deriving useful knowledge from data was needed, they had to look upon the past in order to design the new strategy to follow.
In Mexico, municipalities are the cells of the public administration, it’s the smallest and closest form of governance (also known as the first form of governance) and they have the benefit of managing freely their budget, both income and spending, therefore even if it’s sometimes overlooked, its crucial to improve the conditions in which the population lives.
The Constitution estipulate that the main obligation carried by the City Halls is to provide all basic public services to the inhabitants of the municipality, namely: water and sewage systems, water treatment, street lightnings, waste recollection and disposal, marketplaces, cemetery, street maintenance, public parks, as well as public safety, which is also an obligation for States.
As mentioned above, the goal for this investigation was to analyse the current state of the budget spending across the last 20 years, in order to determine how to better allocate the City Hall resources.
document
Total revenue (2000-2019)
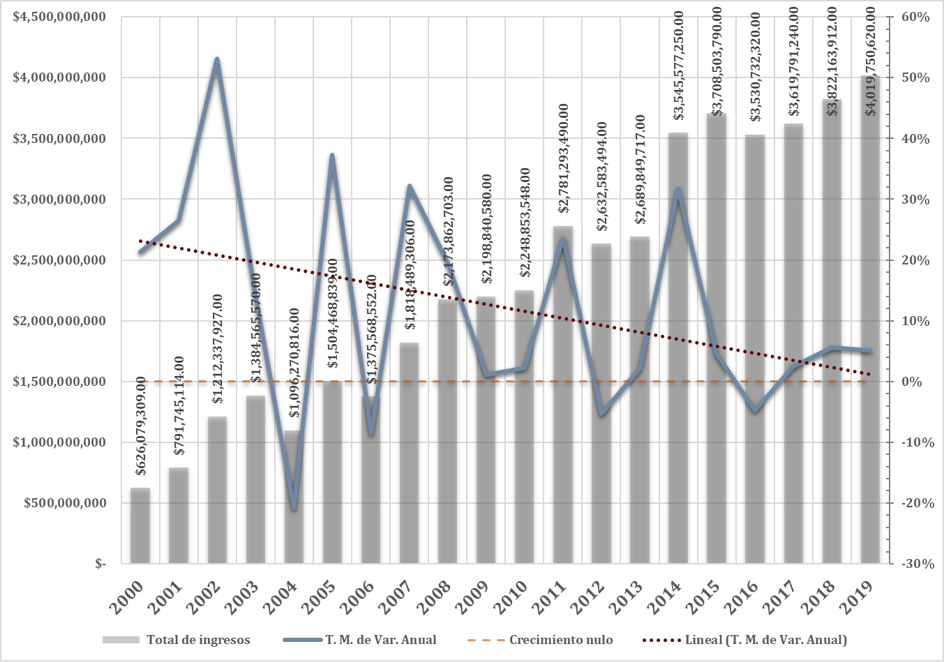
Bars show the amount of revenue per year.
Blue line indicates the average rate of growth.
Orange line indicates the point of zero growth.
Red doted line indicates the linear tendency of the blue line.
We observe sustained growth from 2000 to 2011, after that there’s a decline on revenue. The big increment in 2014 correspond to a legislative change made in the state government. Lastly, we can appreciate how the revenue has been rather static for the last six years. Overall, the growth rate has been declining as shown by the blue line and the trend showcased in the red dotted line. The result poses several challenges, first of all not all years the revenue grows which makes harder forecasting and ultimately the budgeting task, moreover as the trend explains each year the amount of revenue declines at a slow but steady pace.
Revenue composition (2009-2019)
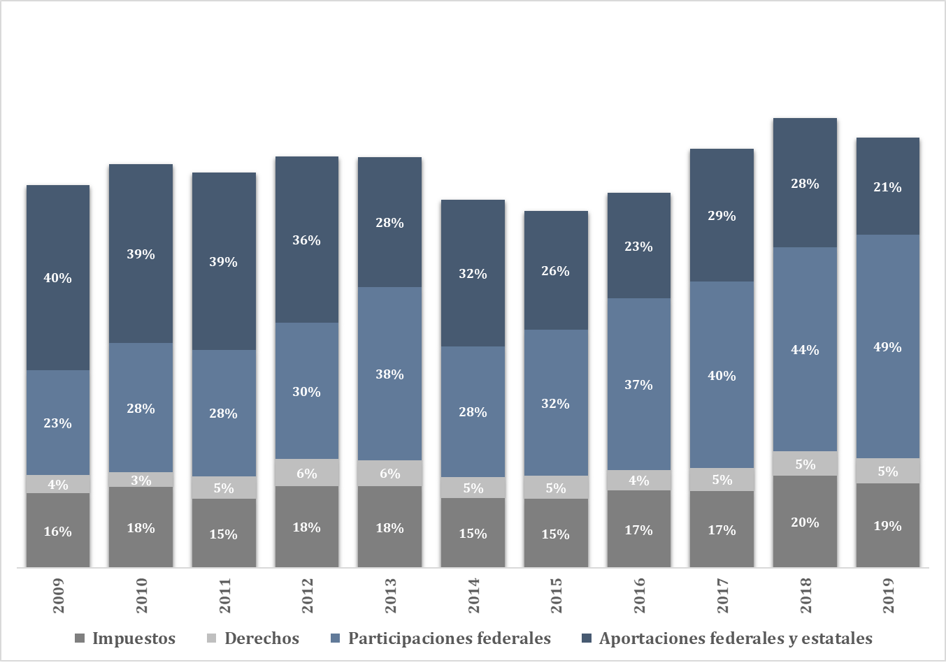
First level show local tax revenue as a % of total revenue.
Second level show revenue received for services rendered as a % of total revenue.
Third level show federal transferences given to the City Hall as a % of total revenue.
Fourth level show federal funds provided to the City Hall as a % of total revenue.
The revenue is composed mainly on these 4 subjects, in between 15 and 20% from local tax recollection, a small proportion on income received for services rendered by the City Hall, the next 2 subjects correspond to federal money transferred to the Hall. As we can appreciate, a rather large proportion of income comes from allocations made by higher government levels which ultimately means that the liberty to increase the total revenue is quite limited and therefore the effort needed is larger.
Local taxes revenue (2000-2019)
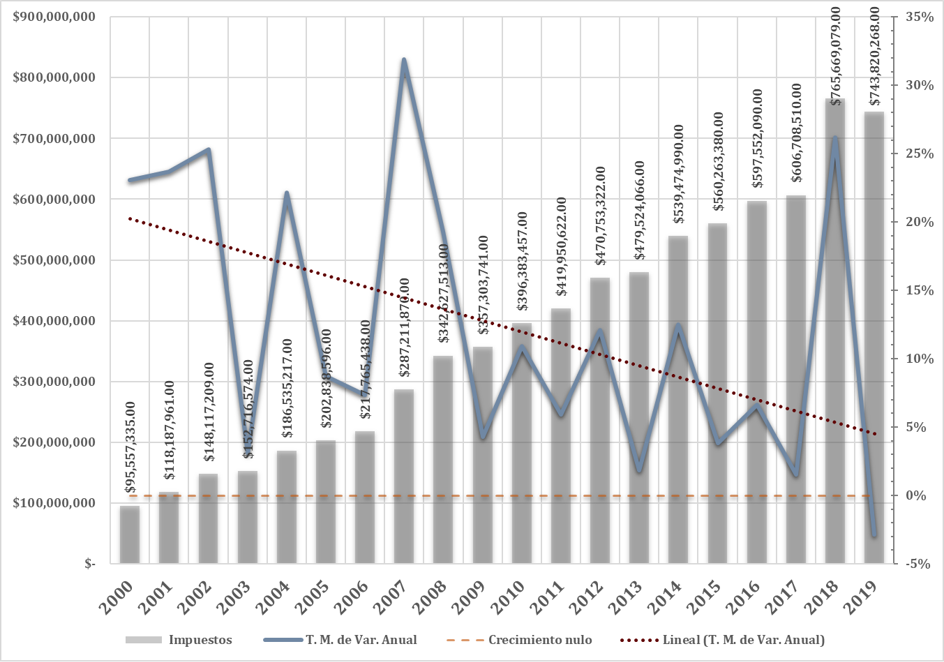
Bars show the amount of revenue per year.
Blue line indicates the average rate of growth.
Orange line indicates the point of zero growth.
Red doted line indicates the linear tendency of the blue line.
As showcased before, even though the City Hall has full liberty in how to use its resources, the possibility to implement measures to increase revenue are slim, the main method would be to be more efficient in tax recollection, which they aren’t. Following the trend explained in the first chart, there’s a sustained decreased on tax recollection, but there’s room to improve, as seen in 2018 there was a major outbreak on taxes, which meant higher revenue, that years strategy has to be studied and build upon that.
Weight of federal transfers and federal funds vs own collected revenue (2000-2019)
Bar shows the % of revenue from federal transfers and funds per year.
Bar shows the % of revenue from local tax collection per year.
Bar shows other sources of income per year.
We can now observe how federal transfers and funds have gained major importance over the total revenue subtracting importance and incentives to improve on local tax efficiency. From a 50/50 split we are now at a 70/30 ratio.
Local revenue vs funds and transfers coefficient (1989-2019)
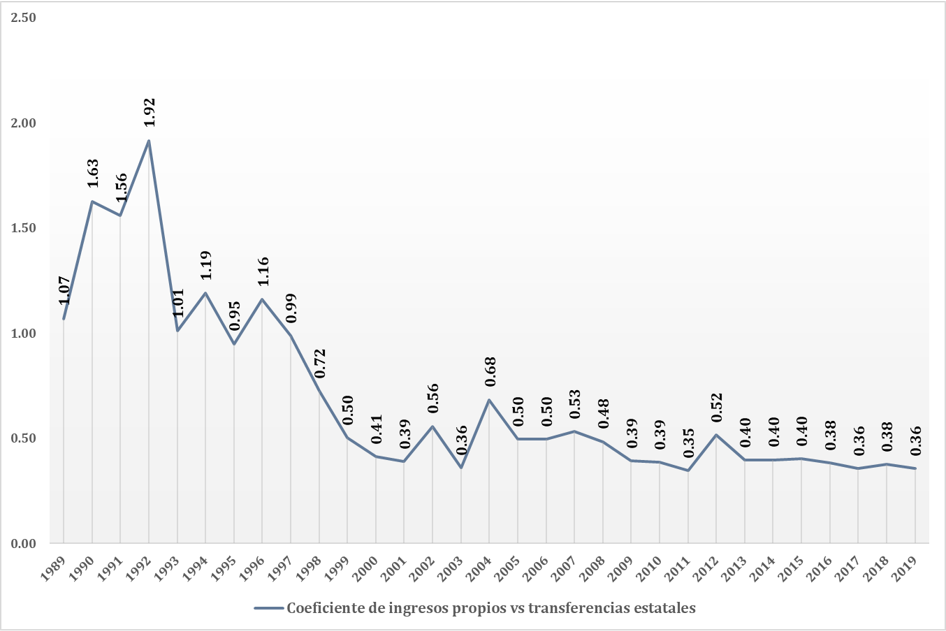
Line shows coeficient between federal transfers and funds / own collection.
For a better visualization we can create a coefficient which shows how many mexican pesos (MXN) have been collected from own sources versus external ones since 1989, we can now appreciate how at the beginning Toluca City Hall collected 1.07 MXN for each 1 MXN received, nowadays the Hall collects .36 MXN for each MXN brought by transfers and funds.
insights
The conclusion on this data is that each year the importance of receiving federal funds and transfers grows larger, on the contrary the local tax efforts decrease. That poses several threats to budget independence and therefore the spending (not included here but analysed in the full document). To ensure the sustainability of the municipality Toluca has to strategize in order to further develop their tax capabilities. One useful insight we got from the data is that in 2018 there was a solid growth on the matter, which means that there’s room to improve upon that year’s management.
Final document
This contains 15 pages out of 105 on the final document.
Presupuesto-Toluca-Secretaria-del-Ayuntamiento-Showcase